Introduction
Whole Exome Sequencing
a. sequence alignment, reads filtering, realignment, quality recalibration, and reads mapping QC
| Normal 1 | Tumor 1 | Normal 2 | Tumor 2 | Normal 3 | Tumor 3 | |
|---|---|---|---|---|---|---|
| Reference size | 3,095,693,983 | 3095693983 | 3,095,693,983 | 3,095,693,983 | 3,095,693,983 | 3,095,693,983 |
| Number of reads | 86,706,324 | 102627622 | 109,799,781 | 83,914,383 | 115,869,230 | 80,665,035 |
| Mapped reads | 86,587,441 / 99.86% | 102,588,905 / 99.96% | 109,762,294 / 99.97% | 83,877,722 / 99.96% | 115,832,856 / 99.97% | 80,626,945 / 99.95% |
| Unmapped reads | 118,883 / 0.14% | 38,717 / 0.04% | 37,487 / 0.03% | 36,661 / 0.04% | 36,374 / 0.03% | 38,090 / 0.05% |
| Paired reads | 86,587,441 / 99.86% | 102,588,905 / 99.96% | 109,762,294 / 99.97% | 83,877,722 / 99.96% | 115,832,856 / 99.97% | 80,626,945 / 99.95% |
| Mapped reads, only first in pair | 43,286,063 / 49.92% | 51,291,221 / 49.98% | 54,880,805 / 49.98% | 41,914,696 / 49.95% | 57,916,798 / 49.98% | 40,300,489 / 49.96% |
| Mapped reads, only second in pair | 43,301,378 / 49.94% | 51,297,684 / 49.98% | 54,881,489 / 49.98% | 41,963,026 / 50.01% | 57,916,058 / 49.98% | 40,326,456 / 49.99% |
| Mapped reads, both in pair | 86,573,278 / 99.85% | 102,582,802 / 99.96% | 109,755,824 / 99.96% | 83,872,753 / 99.95% | 115,826,907 / 99.96% | 80,621,834 / 99.95% |
| Mapped reads, singletons | 14,163 / 0.02% | 6,103 / 0.01% | 6,470 / 0.01% | 4,969 / 0.01% | 5,949 / 0.01% | 5,111 / 0.01% |
| Read min/max/mean length | 30 / 100 / 99.94 | 30 / 100 / 99.96 | 30 / 100 / 99.97 | 30 / 100 / 99.92 | 30 / 100 / 99.97 | 30 / 100 / 99.93 |
| Clipped reads | 1,256,415 / 1.45% | 1,267,288 / 1.23% | 1,334,414 / 1.22% | 1,315,628 / 1.57% | 1,513,714 / 1.31% | 1,162,661 / 1.44% |
| Duplicated reads (estimated) | 29,861,320 / 34.44% | 39,939,833 / 38.92% | 41,033,470 / 37.37% | 28,890,082 / 34.43% | 48,801,888 / 42.12% | 28,795,360 / 35.7% |
| Duplication rate | 32.12% | 35.14% | 33.94% | 31.05% | 38.01% | 32.21% |
This table summarized all read mapping statistics: total reads, mapped reads, un-mapped reads, paired reads, Mapped reads for first pair, second pair, both in pair or singletons. The maximum, minimum and mean read length, and finally the duplication rate of reads.
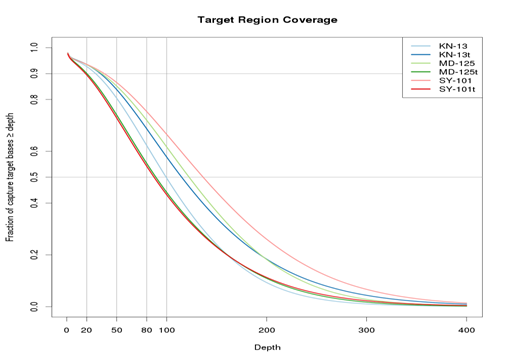
This plot showed good exome coverage of these samples in WES. The average coverage of each sample is more than 80. X-axis is the read depth (coverage) and y –axis is the fraction of target region with depth more than the number in x-axis.
b. Germline variants, compared to reference genome
c. Somatic mutations if Tumor-Normal pair (SNP, INDEL, CNV and SNV variant filtering, calling and annotation)
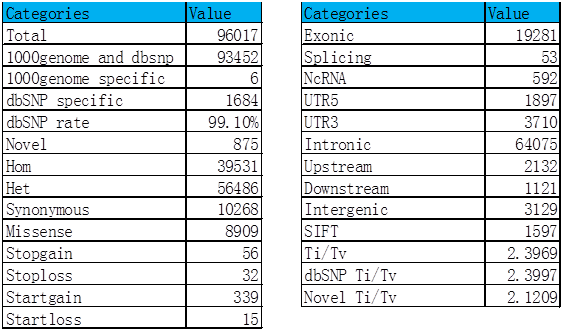
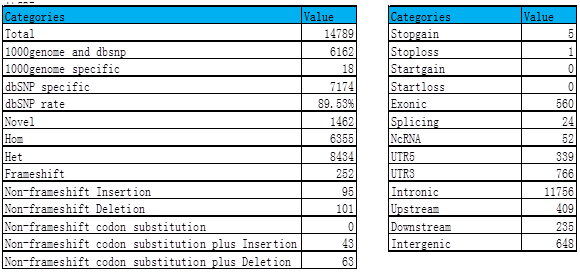
(1) SNP analysis
Sample 1:
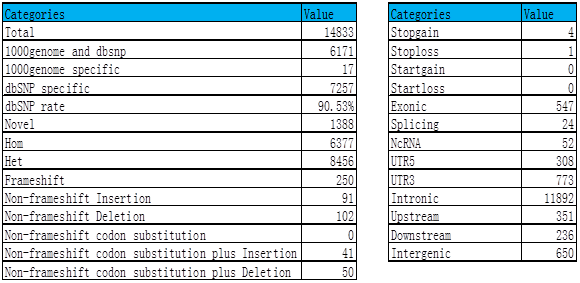
(2) INDEL analysis
Normal sample:

(3) SNV analysis
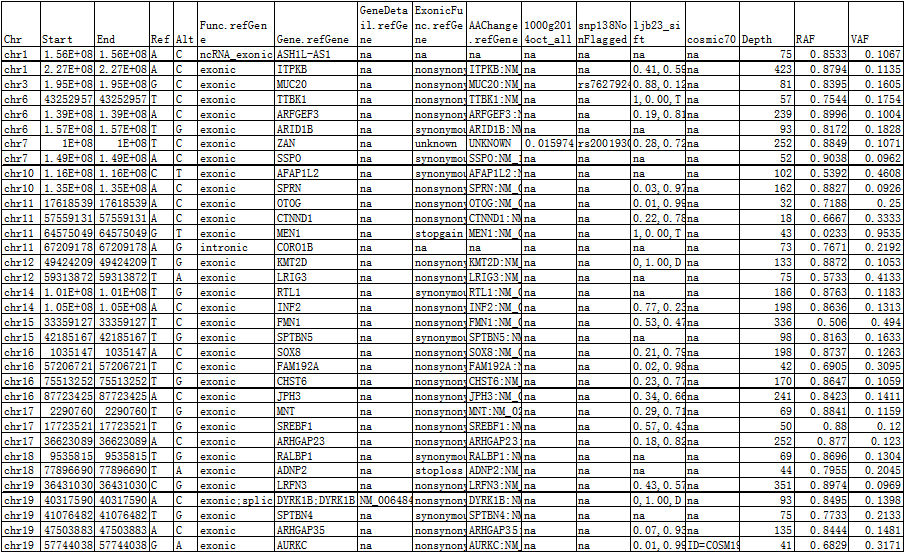
Novel somatic mutations results table:
Novel LOH results table:
