02-08-2021 By Quick Biology
Glioblastoma Multiforme (GBM) accounts for about 15% of all intracranial tumors and about 60% of astrocytic tumors, it often occurs between the age of 45 and 70. Although it is rare, with an incidence of 2-3 new cases per 100,000 people in the United States and Europe, patients with GBM have a dismal prognosis, usually survive less than 15 months with standard-of-care therapy, and survival without treatment (at least surgery) is only 4-6 months. Previous work mainly focused on the role of genes on GBM survival or on the maintenance of glioblastoma stem cells (GSCs).
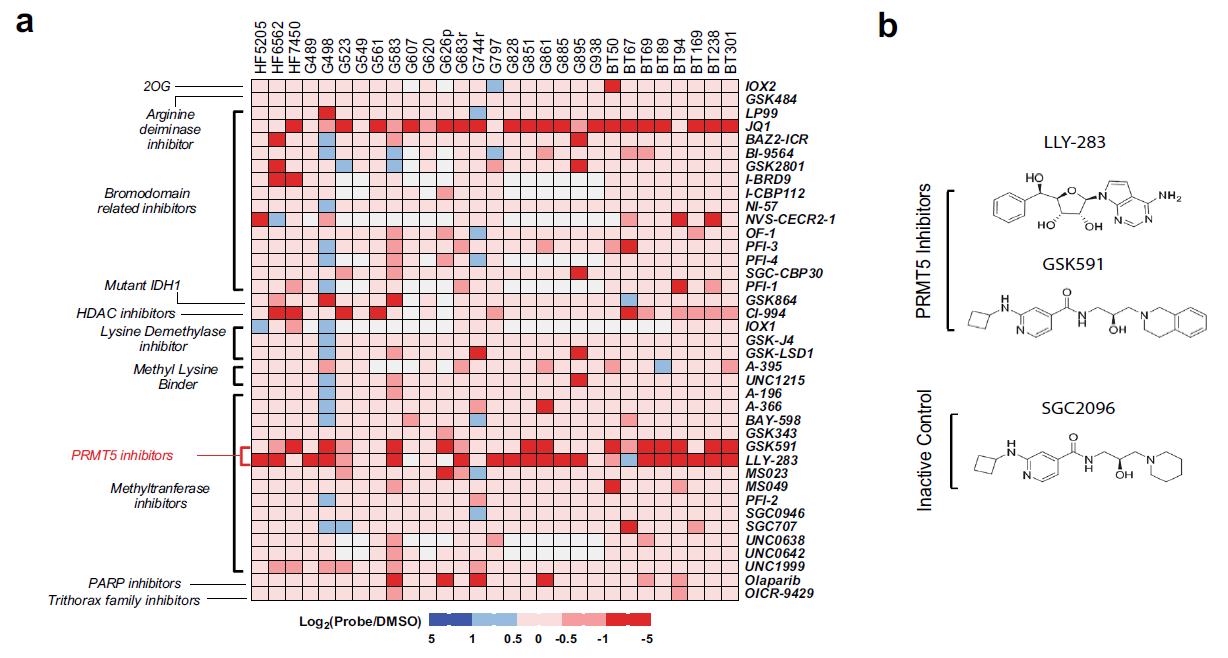
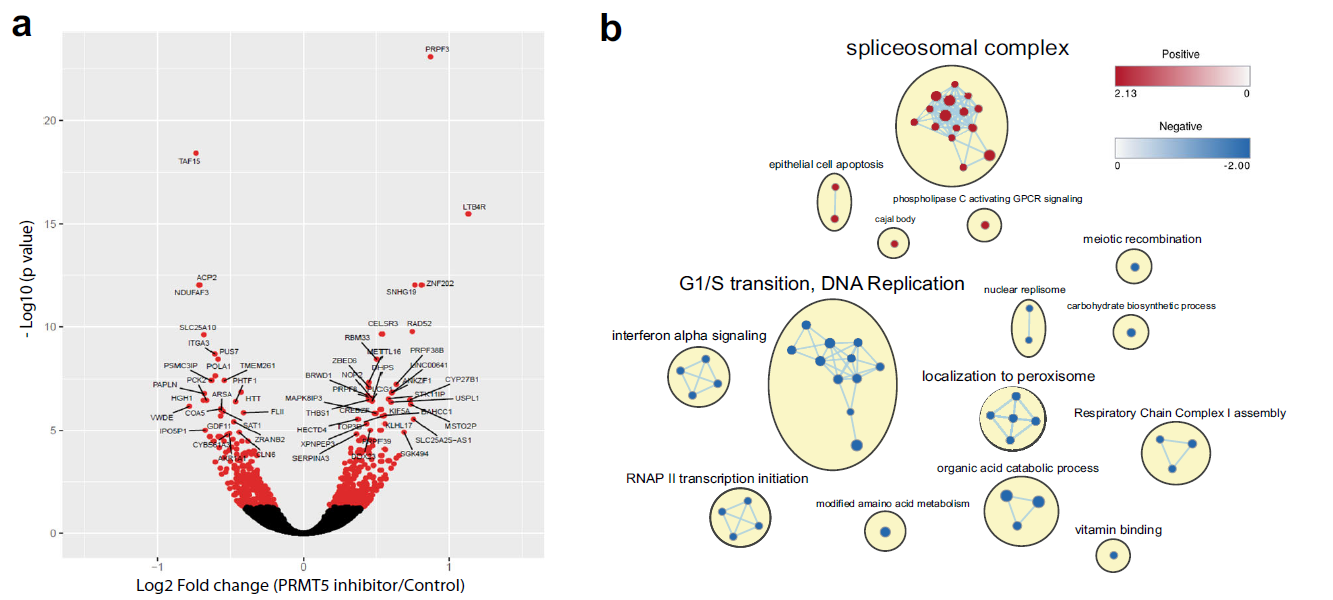
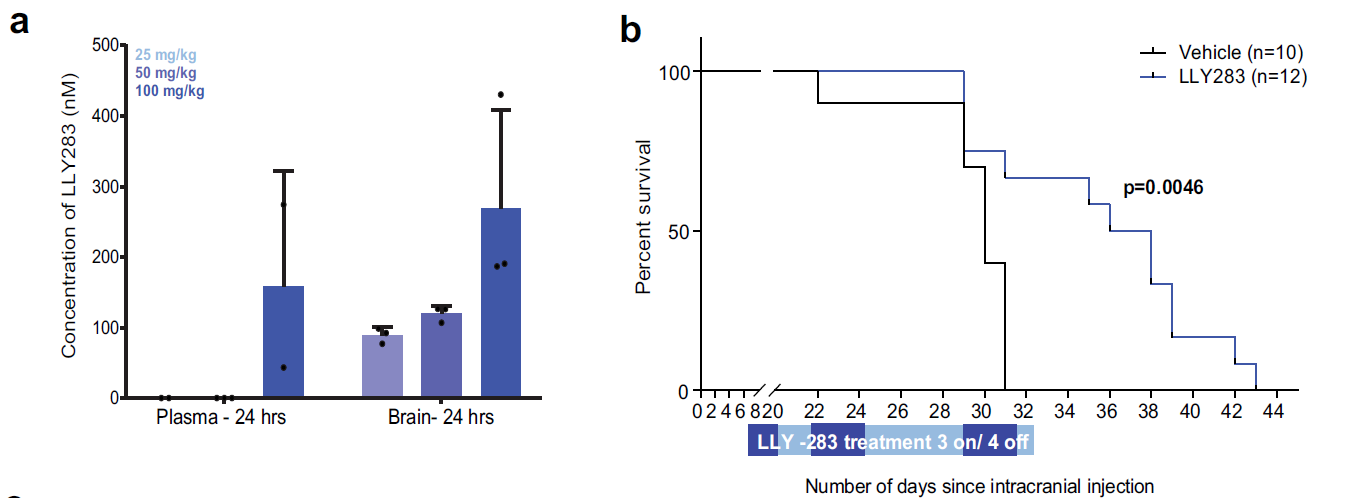
Epigenetic regulation has been identified as a key player in GBM. In recent Nature Communications, Dr. Sachamitr and their colleagues first screened a library of 39 well-characterized epigenetic chemical probes in 26 patient-derived GSC lines (Fig.1, ref1). They found GSK591 and LLY-283 as PRMT5 (protein arginine methyltransferase 5) inhibitors impairs the proliferation and sphere-forming capacity of GSCs and primary GBM cells in 46 patient-derived GSCs. By performing RNA-seq, they show that PRMT5 inhibition causes widespread splicing changes, particularly affecting genes in cell cycling (Fig.2). More importantly, LLY-283 is brain-penetrant and significantly prolongs the survival of mice with orthotopic patient-derived xenografts (Fig.3). Their data provide a rationale for the clinical development of brain penetrant PRMT5 inhibitors as a treatment for GBM.
Figure 1: Cell confluence heatmap of small molecule epigenetic screen showing significant inhibition of GSC proliferation by PRMT5 inhibitors. The screen was performed on 26 GSC lines and 3 control cell lines against 39 epigenetic chemical probes. Red squares indicate decrease in cell confluence and blue squares indicate an increase in confluence relative to the vehicle.

Figure 2: PRMT5 inhibition leads to deregulation of alternative splicing, affecting regulators of cell cycle. a Volcano plot comparing fold change (x-axis) and p value obtained from DESeq2 analysis (y-axis) of the expressed genes between GSC lines treated with GSK591 and SGC2096 (n = 3). Red dots indicate significantly differentially expressed genes. b Gene-set enrichment analysis (GSEA) of all ranked differentially expressed genes (DEGs), visualized in Cytoscape. Networks of related ontologies (shown as colored nodes (red—upregulated; blue— downregulated) connected by blue lines, representing common genes between gene sets are circled and have been assigned group labels.

Figure 3: Pharmacological inhibition of PRMT5 significantly extends survival of mice with orthotopic xenografts of GSCs. a Concentration of LLY-283 in the plasma and brain of NSG mice 24 h after oral administration of 25, 50, and 100 mg/kg of LLY-283. n =3, mean ± SD. b Kaplan–Meier survival curve of immunodeficient NSG mice injected intracranially with G411 GSCs and treated with 50 mg/kg LLY-283 (Vehicle: n = 10; LLY-283: n =12). Significance was estimated using the log-rank (Mantel–Cox) test (two sided). Chi square= 8.038, p value= 0.0046.

Quick Biology can assist you for RNA-seq and pre-mRNA splicing analysis. Find More at Quick Biology.
See resource:
1. Sachamitr, P. et al. PRMT5 inhibition disrupts splicing and stemness in glioblastoma. Nat. Commun. 1–17 doi:10.1038/s41467-021-21204-5


