2021-03-08 By Quick Biology
As people in the U.S. are receiving the vaccine for SARS-CoV-2, the pandemic slows down. In many states, public schools plan back to normal. High throughput virus test before back to work, full day-in person school learning is critical for controlling any future spread of SARS-CoV-2.
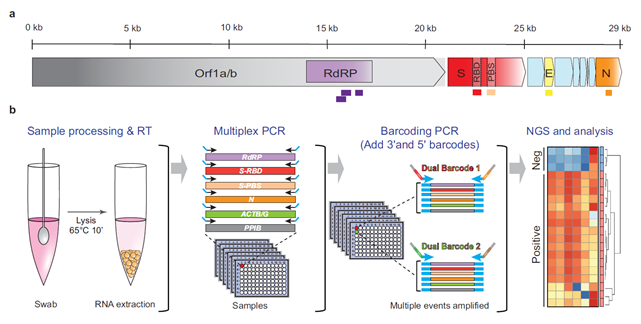
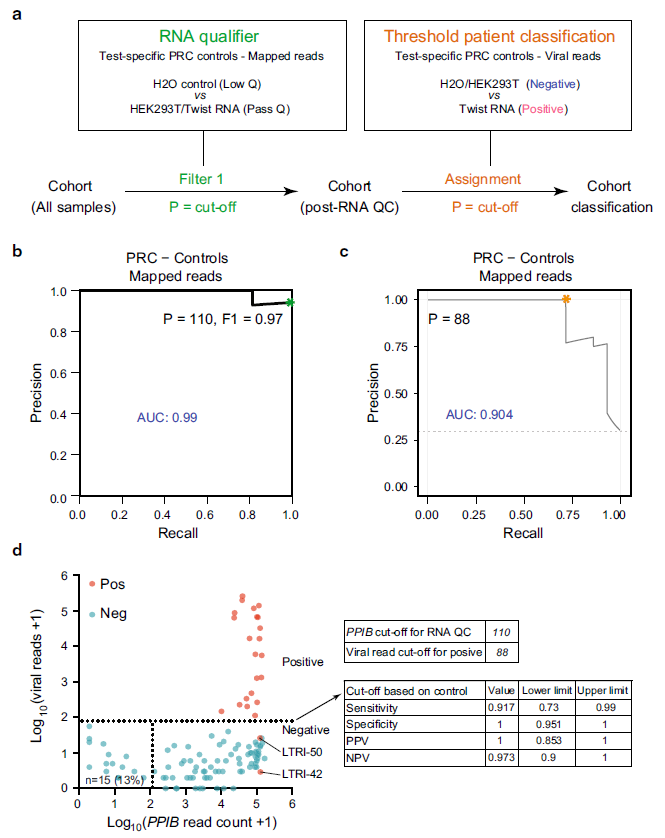
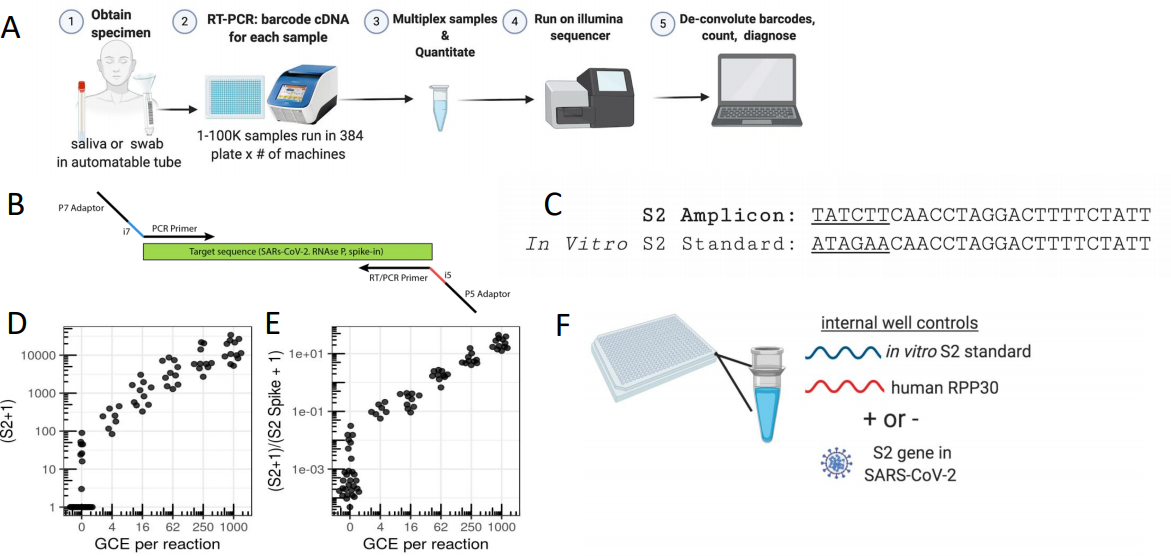
Previously, Quick Biology has summarized NGS strategies for SARS-CoV-2 detection, such as HiDRA-seq using indexed oligo-dT primers in reverse transcription, LAMP-seq using isothermal amplification, ApharSeq using direct RNA virus capturing. In recent Nature communications, researchers in Canada introduced C19-SPAR-Seq “Systematic Parallel Analysis of RNA coupled to Sequencing for Covid-19 Screening” (Fig.1, ref1). Basically, there is no big difference compared to other NGS screenings as mentioned above. The key in C19-SPAR-Seq protocol is that to minimize Non-specific Amplification (NSA), they employ a control-based precision-recall and receiver operator characteristic analysis to assign run-specific quality control metrics (Fig.2). In early medRxiv preprint, UCLA researchers developed SwabSeq. The novelty of SwabSeq is that they incorporate an in vitro RNA standard that mimics the viral amplicon. These internal control RNAs improve quantitation, reduces requirements of automation and sample-to-sample normalization, gives a better ability to call true negatives. Currently, Octant. Inc and Ginkgo Bioworks partner to expand COVID-19 testing capacity using SwabSeq.
Figure 1: C19-SPAR-Seq for SARS-CoV-2 Detection. Schematic representation of the SARS-CoV-2 with the five regions targeted for multiplex C19-SPAR-Seq indicated: RdRP (purple), S receptor-binding domain (Srbd) (red), S polybasic cleavage site (Spbs) (light red), E (yellow), and N (orange). (ref1)

Figure 2: Control-based classifier in C19-SPAR-Seq. a Schematic of the control-based cut-off procedure for RNA quality and viral threshold by coPR analysis. b Thresholding sample quality. coPR analysis on control samples: PRC of control samples for accurate detection of mapped reads are plotted. The optimal precision and recall read cut-off associated (P = 110) with the highest F1 (0.97) score, and AUC (area under the curve) are indicated in the PR plot. c Threshold for classification of positives in the test cohort. Optimum cut-off for viral threshold is calculated by PROC01 using clinical diagnosis and total viral reads and plotted on the precision-recall curve. d Threshold assignments for sample quality and classification. Total viral reads +1 (Y-axis) are plotted against PPIB reads +1 (X-axis) for positive (red) and negative (blue) patient samples. coPR-based RNA-QC filter and viral read filter are shown as indicated. Assay statistics using coPR thresholding are listed (right).

Figure 3: SwabSeq Diagnostic Testing Platform for COVID19. A) The workflow for SwabSeq is a five-step process that takes approximately 12 hours from start to finish. B) In each well, we performed RT-PCR on clinical samples. Each well has two sets of indexed primers that generate cDNA and amplicons for the SARS-CoV-2 S2 gene and the human RPP30 gene. Each primer is synthesized with the P5 and P7 adaptors for Illumina sequencing, a unique i7, and i5 molecular barcodes, and the unique primer pair. Importantly, every well has a synthetic in vitro S2 standard that is key to allowing the method to work at scale. C) The in vitro S2 standard (abbreviated as S2-Spike) differs from the virus S2 gene by 6 base pairs that are complemented (underlined). (D) Read count at various viral concentrations (E) Ratiometric normalization allows for in-well normalization for each amplicon (F) Every well has two internal well controls for amplification, the in vitro S2 standard and the human RPP30. The RPP30 amplicon serves as a control for specimen collection. The in vitro S2 standard is critical to SwabSeq’s ability to distinguish true negatives. (ref2)

Quick Biology can assist you with any NGS projects. Find More at Quick Biology.
See resource:


